Simple home infrastructure monitoring with PHP Server Monitor
Intro
My home network is getting populated with various Raspberry Pis doing mundane tasks, and at some point I wanted a nice view on how everything is doing. Also updating those machines is currently more or less a manual task, so in order to automate stuff, I need a view on how they are doing (in case some update would fail).
Enter: Monitoring.
There is a problem though; majority of the solutions around are do-it-all-and-beyond solutions where I needed a really-really-simple one. I just wanted to know whether some Raspberry Pi is up, and if there is a (web) service running.
TOC
The candidates
The mini project started with taking a view on the landscape of Monitoring, and what options are really options in the use case of another Raspberry entering the fay and doing the monitoring.
DataDog:
This was amongst the first of my candidates, but the free tier wasn’t flexible enough for the project and I’m not too inclined to pay for home monitoring (when I had raspberry lying around).
Nagios/Icinga:
I bet you could monitor a lawnmower with Nagios, so there is support for ARM. Would work, but I have some history with Nagios and we are not friends.
Sensu:
Totally totally would have used this, but you cannot use ARM for server. Caused extensive googling of X86 raspberry alternatives (hint: they are not cheap).
Prometheus:
Totally too much for my Raspberry Pi 1 and for a one evening project for any Pi. Also I think the extensive system is totally too much for just monitoring a few machines on the local network.
Zabbix:
Works with ARM and ended up being my “if I cannot find anything else”-option. This because I had an impression that it would be the least pain in the ass to configure.
Netdata:
Hyped in reddit, so tested it. It definitely works, but really, is this something you want to use to visualize status data on?
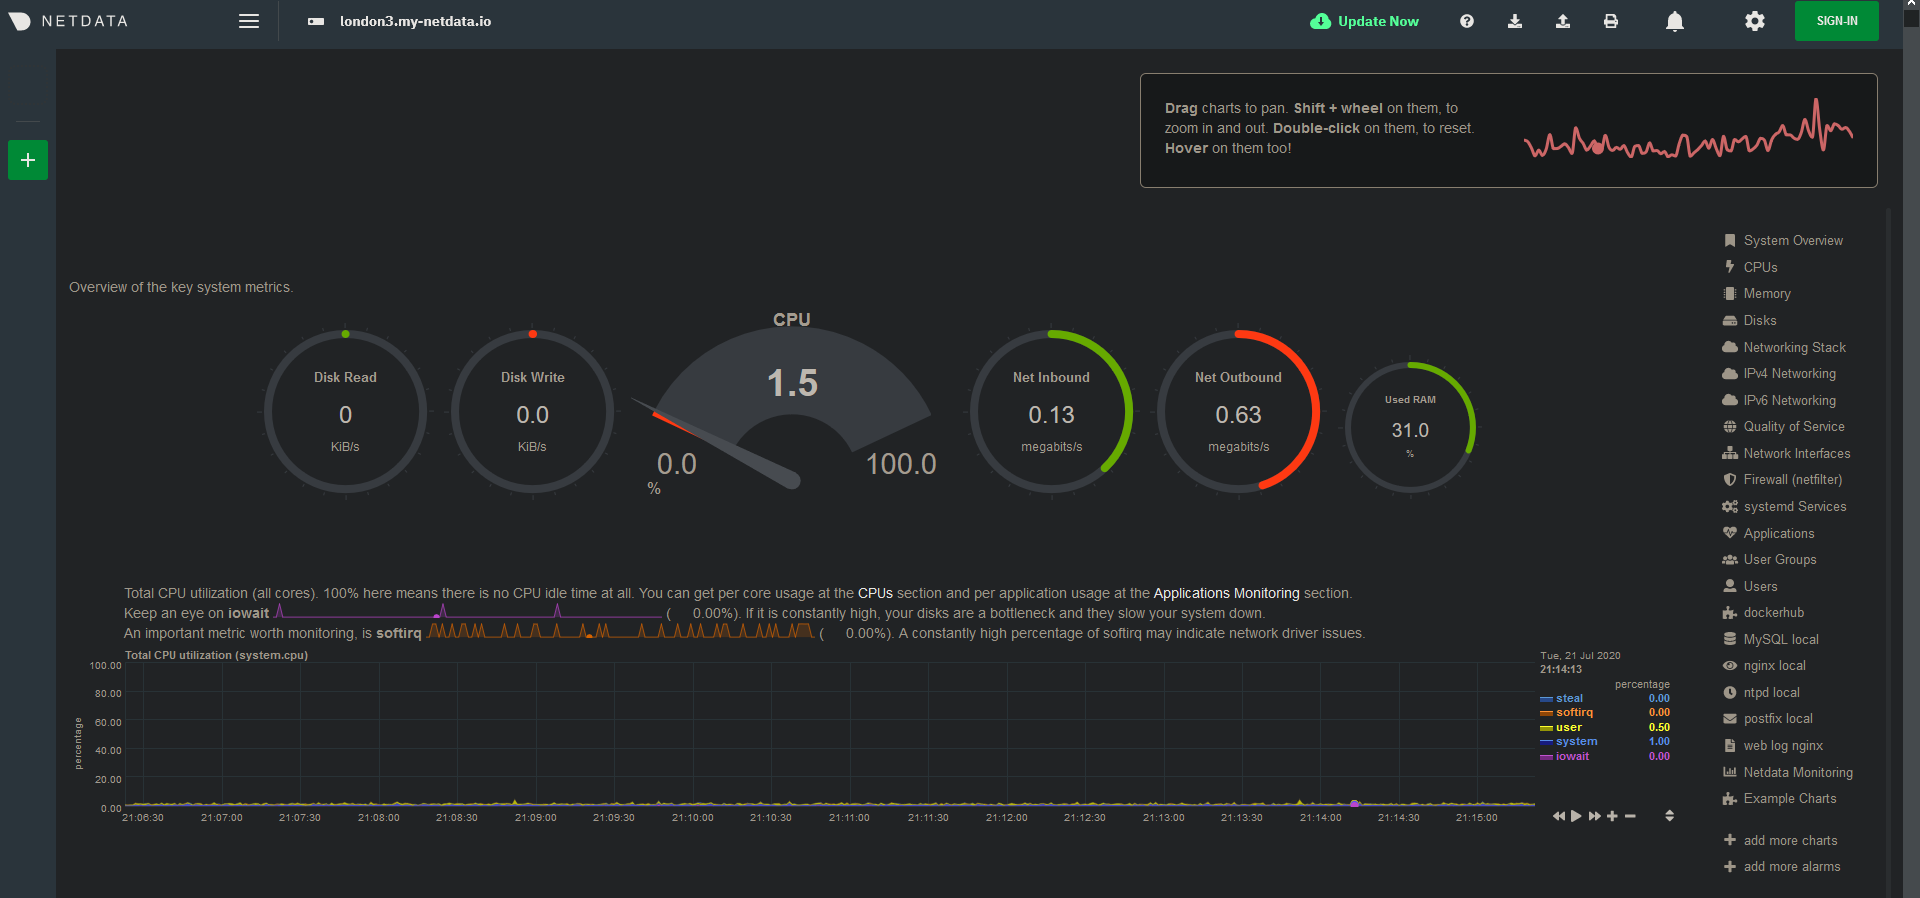 If you are old as me, the answer is ‘no’. Or in Netdata-terms a pie-chart with an indicator on 12’clock.
PHP Server Monitor:
Also something I found while browsing reddit. Something I had never heard about before. A php web application with MySql backend, simple af. Also found a how-to on getting it running. Sold!
Getting PHP Server Monitor running
The official installation instructions can be found here. Installing the php app itself is a simple task, but there are few requirements, such as a web server and a database. There was a nice howto on those found here. But it’s two years old, and I would like to use mariadb instead of mysql, so it does not completely apply as things are now in 2020.
Prerequisites
First we have to install the dependencies:
sudo apt-get install php7.3 php7.3-curl php7.3-mysql mariadb-server
we can configure it:
sudo mysql_secure_installation
we login to the database as root:
sudo mariadb
create database phpservermon;
create user 'phpservermon'@'localhost' IDENTIFIED BY 'password';
 grant all privileges on phpservermon.* TO 'phpservermon'@'localhost';
flush privileges;
Configure php:
sudo vim /etc/php/7.3/apache2/php.ini
#uncomment date.timezone and set your timezone
date.timezone = "Europe/Helsinki"
Also if you haven’t already, set the date on your raspberry or you spend some time trying to figure why your hosts aren’t being scanned (totally did, they were scanned, but the timestamps were 2 hours in the past).
Configure apache:
sudo cp /etc/apache2/sites-available/000-default.conf /etc/apache2/sites-available/phpservermon

#Modify /etc/apache2/sites-available/phpservermon server root to point to directory above, also add a ServerName if desired
Personally my phpservermon raspberry is a one trick pony, so I just disabled the default apache page and enabled the php servermon
sudo a2dissite 000-default
sudo a2ensite phpservermon
sudo service apache2 reload
PHP Server Monitor
I ended up with structure like this:
/var/phpservermon/versionxyz # versions in paths
/var/www/phpservermon        # a symbolic link to current version
cannot really rationalize it all the way through, but thought it would be nicer for updates and rollbacks.
For the installation, just get the latest release from Php Server Monitor site, extract it and follow the official documentation on installation. The installation of the software shouldn’t take more than a few minutes.
(I couldn’t get the first step working, running the install.php, so I used the alternative path of doing the configuration in shell, just as instructed on the documentation)
Cron
As it’s just a php app, it has no background worker process to poll your targets. In order to update the statuses, you can either refresh the status from the app itself, or just run a simple cron:
*/2 * * * * /usr/bin/php /var/www/phpservermon/cron/status.cron.php
I used every second minute as the polling interval, but do whatever suits you
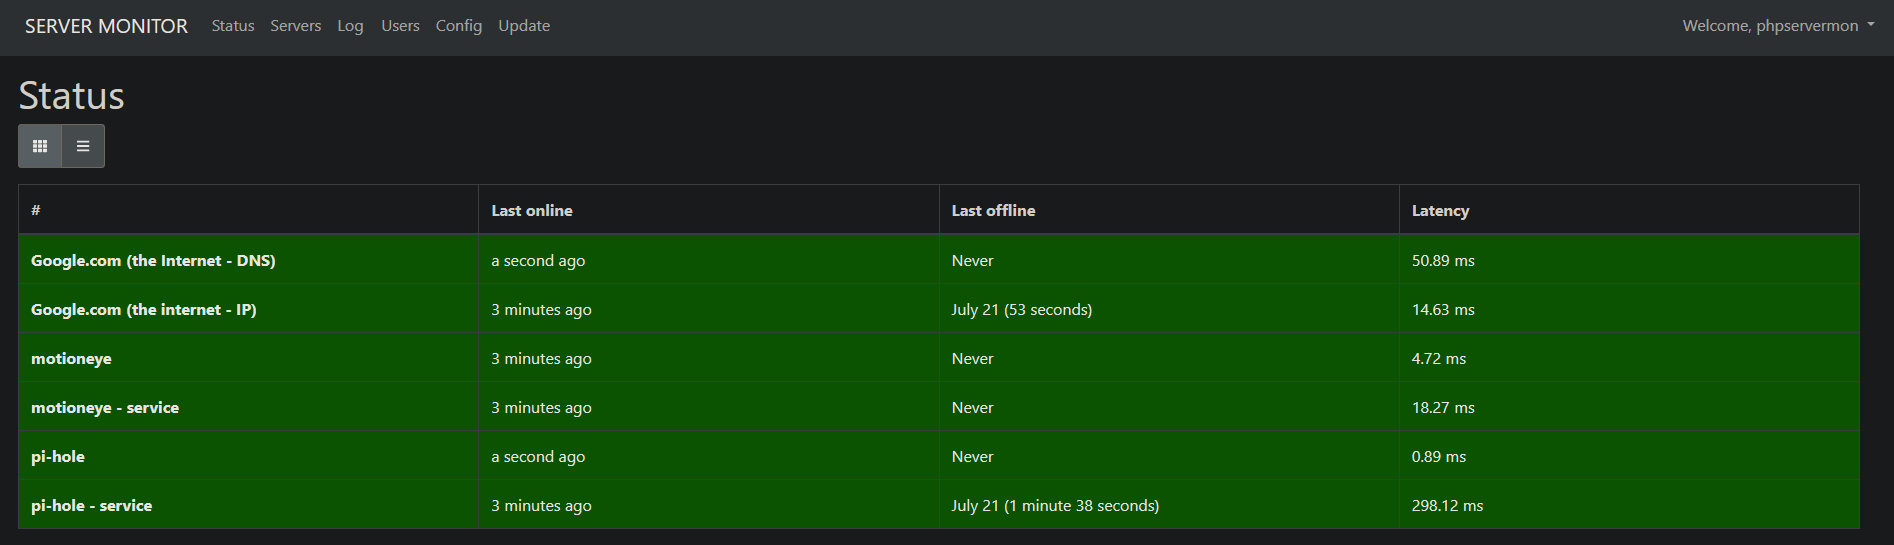
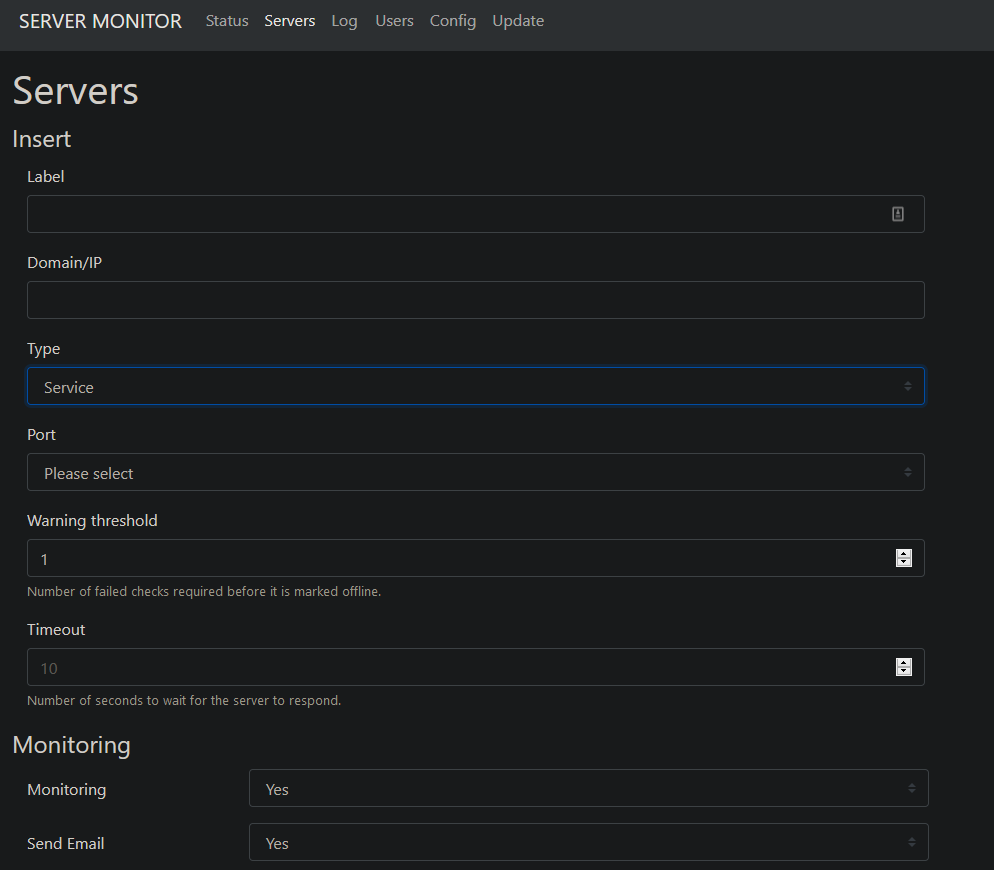
Configuring targets
In its most simple form: super simple stuff. Only a little bit more complicated when doing website polling, allowing definition of request methods and patterns.
Telegram notifications
Step that took me plus 2 weeks to accomplish, as I thought it would be a hassle. But it’s not. It really took me some 5 min to initially step up, and one round of debugging.
Just follow these instructions to
- Setup a bot, get
api token - Go to your bot and get
chat id - Give the
api tokenid to PHP Server Monitor on Config - Activate the bot (this is something I missed initially) via PHP Server Monitor
- On your PHP Server Monitor profile, set your
chat id
And a real-lifeish test-case by unplugging the motioneye, waiting for the notification never to arrive, notice the requirement of activating the bot, activate the bot, power up the motioneye, be pleasantly suprised by the following message:
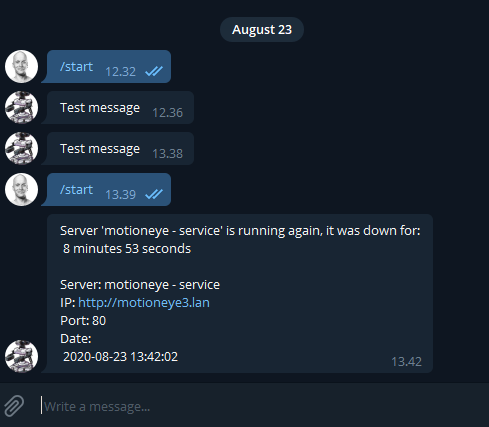
And it’s done! Monitor setup, ready to be forgotten until first service in the home network goes down.